 how-to
Detecting Peptide Degradation: A Mass Spectrometry Guide
Last Updated: October 23, 2026
Quick Summary
Peptide degradation mass spectrometry detects peptide breakdown through characteristic mass shifts and chromatographic separation. Oxidation adds 16 Da per methionine or tryptophan residue, deamidation adds 1 Da per asparagine or glutamine, and hydrolysis removes 18 Da, each producing distinct signals in LC-MS analysis.
- Store peptides at -20°C or colder in sealed containers and avoid repeated freeze-thaw cycles to minimise degradation before analysis.
- Use reverse-phase HPLC with gradient elution to separate intact peptides from degradation products before mass spectrometry detection.
- Establish signal-to-noise thresholds of 3:1 or 10:1 to distinguish real degradation peaks from instrumental noise and false positives.
- Conduct time-course stability studies at multiple timepoints to quantify degradation rates under your intended storage and use conditions.
Table of Contents
- Understanding Peptide Degradation and Why Detection Matters
- Peptide Sample Preparation for Mass Spectrometry
- Liquid Chromatography-Mass Spectrometry (LC-MS) Fundamentals
- Detecting Peptide Oxidation Using Mass Spectrometry
- Peptide Deamidation Analysis and Identification
- Peptide Stability Testing by LC-MS
- Troubleshooting Common Issues and Avoiding False Positives
- Frequently Asked Questions
Understanding Peptide Degradation and Why Detection Matters
Peptide degradation represents one of the most significant challenges in peptide research and development. Whether you're working in academic research, biotech, or quality assurance, understanding how peptides break down, and detecting those degradation products, directly impacts your experimental reliability and product quality.
Peptide degradation mass spectrometry has become essential for anyone handling peptides at scale.
Peptide degradation occurs through several pathways. Hydrolysis breaks peptide bonds through water exposure. Oxidation damages susceptible amino-acid residues like methionine and tryptophan. Deamidation converts asparagine and glutamine residues into aspartate and glutamate, shifting the peptide's molecular mass.
Why does this matter? A single undetected degradation product can skew your results. It can invalidate batch consistency claims. According to research from the National Institutes of Health on peptide characterisation, multiple reaction monitoring mass spectrometry remains the technology of choice for detecting and quantifying analytes in complex samples, including degraded peptide forms.
The good news: modern mass spectrometry workflows make detection straightforward once you understand the fundamentals.
Peptide Sample Preparation for Mass Spectrometry
What you do before analysis determines what you'll find during it. Poor sample preparation introduces artefacts. It masks real degradation. It creates false positives that waste your time troubleshooting non-existent problems.
Proper peptide sample preparation starts with storage and handling, then moves through extraction and buffer selection. Both steps directly influence whether your mass spectrometry results reflect actual peptide degradation or preparation artefacts.
Storage and Handling Considerations
Your peptide samples begin degrading the moment they're synthesised. Temperature, light exposure, humidity, and oxygen all accelerate the process. Freezing slows degradation dramatically, but only if done correctly.
Store peptides at -20°C or colder in sealed, airtight containers. Avoid repeated freeze-thaw cycles; each cycle introduces ice crystal formation that can damage peptide structure. Use single-use aliquots when possible. If you must reuse a vial, work quickly and minimise air exposure.
Lyophilised peptides (freeze-dried powder) remain stable longer than peptides in solution. Solution-based peptides degrade faster because water exposure accelerates hydrolysis. Learn how to prevent peptide oxidation in your lab samples to extend shelf life and reduce background degradation before analysis begins.
Light-sensitive peptides, those containing aromatic residues or photolabile groups, require amber or opaque vials. Store them away from direct sunlight and laboratory lighting when possible.
Extraction and Buffer Selection
When you're ready to analyse your samples, extraction method and buffer chemistry matter enormously. The wrong buffer can trigger degradation during sample preparation itself.
Use buffers that maintain neutral to slightly acidic pH (6.5-7.5 for most peptides). Extreme pH accelerates hydrolysis. Include antioxidants like ascorbic acid or EDTA if your peptides contain oxidation-prone residues. These additives prevent artefactual oxidation during sample handling.
For peptides stored in organic solvents, use organic-compatible buffers. Mixing incompatible solvents can cause peptide precipitation, which looks like degradation on your mass spectrometry readout but is actually a preparation artefact.
Keep extraction times short. Prolonged incubation in buffer increases hydrolysis risk. Most peptides extract fully within 15-30 minutes at room temperature.
Liquid Chromatography-Mass Spectrometry (LC-MS) Fundamentals
LC-MS combines two complementary analytical techniques for peptide degradation mass spectrometry. Liquid chromatography separates intact peptides from degradation products before they reach the mass spectrometer. The mass spectrometer then identifies each separated component by its molecular mass and fragmentation pattern.
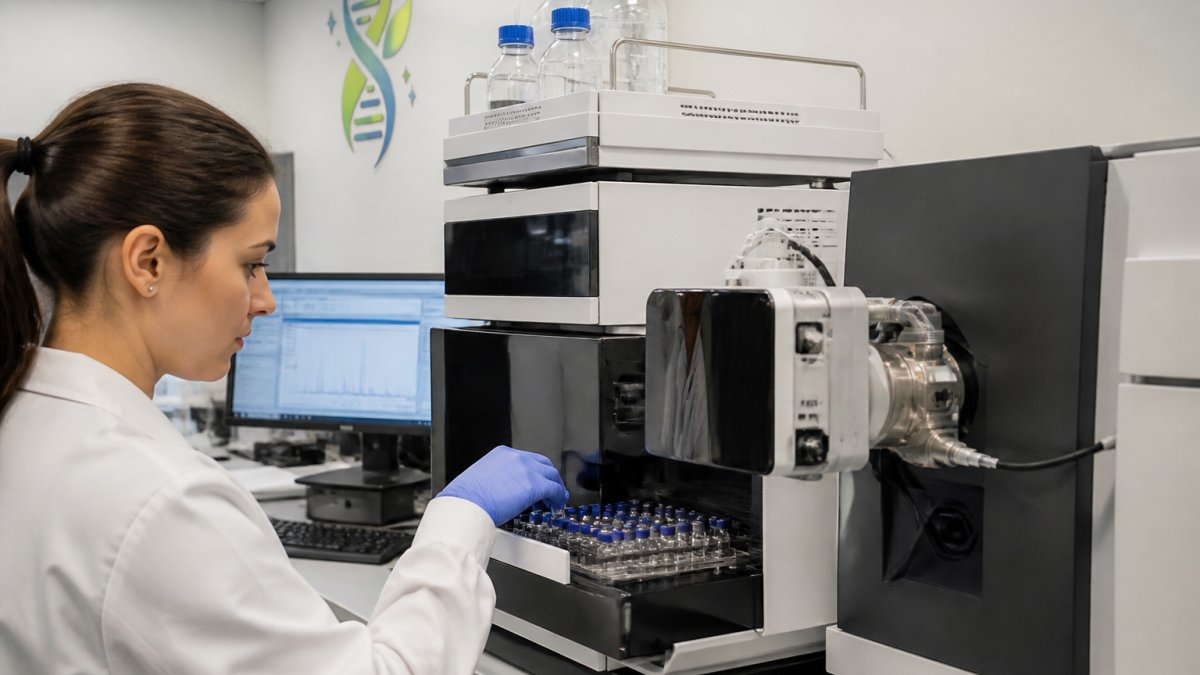
Understanding how each component works, and how they work together, is essential for designing workflows that actually detect the degradation you're looking for.
How HPLC Separates Intact Peptides from Degradation Products
High-performance liquid chromatography (HPLC) pushes your sample through a column packed with stationary phase material. Different peptide forms, intact, oxidised, deamidated, truncated, interact with this material differently. They elute (exit the column) at different times, creating temporal separation before they reach the mass spectrometer.
This separation is critical. Without it, a mass spectrometer sees a mixture of intact and degraded forms simultaneously. Individual components blur together. You lose the ability to quantify each form separately.
Reverse-phase HPLC works well for most peptide separations. The stationary phase is hydrophobic (water-repelling). Peptides with more hydrophobic character stick longer and elute later.
Gradient elution accelerates separation. You begin with high water content and gradually increase organic solvent (usually acetonitrile). Peptides elute in a predictable sequence based on their hydrophobicity. Total run time typically ranges from 10-30 minutes depending on your column and gradient profile.
Explore best practices for peptide storage to maintain stability through analysis, ensuring your chromatographic separation reflects real degradation rather than preparation-induced changes.
Ionisation and Mass Analysis
Once your separated peptide components exit the HPLC column, they enter the mass spectrometer's ionisation source. Here, each peptide molecule gains or loses electrons, becoming charged. Only charged particles can be manipulated by the mass spectrometer's electromagnetic fields.
Electrospray ionisation (ESI) is the standard for peptide analysis. A high voltage creates a fine mist of charged droplets from your liquid sample. Solvent evaporates, leaving bare peptide ions.
The mass analyser then measures the mass-to-charge ratio (m/z) of each ion. For a peptide with 20 amino acids and a molecular mass of 2,200 Da carrying a +2 charge, the observed m/z would be approximately 1,100.
This is where degradation becomes visible. A truncated peptide missing five residues has a lower molecular mass. Its m/z shifts downward. An oxidised peptide gains 16 Da (one oxygen atom).
Detecting Peptide Oxidation Using Mass Spectrometry
Oxidation is perhaps the most common peptide degradation pathway. Methionine and tryptophan residues are especially vulnerable. A single oxidised methionine adds 16 Da to your peptide's mass.
Mass spectrometry detects oxidation through intact-mass measurement. You measure the molecular mass of your peptide before and after oxidative stress. If oxidation has occurred, the mass increases by predictable amounts:
- Methionine oxidation: +16 Da
- Tryptophan oxidation: +16 Da (mono-oxidation) or +32 Da (di-oxidation)
In your LC-MS workflow, oxidised peptides often elute at slightly different retention times than intact forms. They also show distinct m/z values. By comparing peak areas at different m/z values, you can quantify what percentage of your sample has oxidised.
Modern techniques demonstrate the sensitivity of mass spectrometry, meaning even minor oxidative degradation becomes visible in your data.
To minimise oxidation artefacts during sample preparation, include antioxidants in your buffers. Ascorbic acid is common. Nitrogen purging of your sample vial removes dissolved oxygen. These simple steps prevent preparation-induced oxidation and ensure your results reflect actual sample degradation.
Mass spectrometry detects oxidation through characteristic mass shifts that reveal which amino acids have been damaged.
| Oxidation Type | Mass Shift | Detection Method |
|---|---|---|
| Methionine oxidation | +16 Da | Intact-mass measurement |
| Tryptophan mono-oxidation | +16 Da | Intact-mass measurement |
| Tryptophan di-oxidation | +32 Da | Intact-mass measurement |
| Oxidised peptides | Different retention time | LC-MS chromatography |
Peptide Deamidation Analysis and Identification
Deamidation is a silent degradation pathway. Your peptide's mass barely changes, only 1 Da per deamidated residue, yet the chemical structure shifts significantly. Asparagine becomes aspartate. Glutamine becomes glutamate (Advances in the Study of Protein Deamidation). Your peptide's charge distribution changes. Its biological activity may be compromised.
Mass spectrometry detects deamidation through two approaches: intact-mass measurement and tandem mass spectrometry (MS/MS).
Intact-mass measurement reveals the overall mass shift. A peptide with two deamidated asparagines gains 2 Da. This is subtle but detectable with high-resolution instruments.
Tandem mass spectrometry provides residue-level detail. After ionisation, peptide ions fragment into smaller pieces. The fragmentation pattern reveals where deamidation occurred. Deamidated residues fragment differently than their intact counterparts, creating diagnostic mass shifts in the fragment ions.
This level of detail matters for stability studies. You don't just want to know that deamidation occurred, you want to know which residues deamidated and how much. This information guides formulation decisions. It helps you predict which peptides will remain stable in your application.
Peptide Stability Testing by LC-MS
Stability studies answer a simple but critical question: how long does your peptide remain intact under your intended storage and use conditions?
A proper stability study involves time-course analysis. You prepare identical samples, store them under defined conditions (temperature, light, humidity), and analyse them at multiple timepoints. LC-MS gives you quantitative data at each timepoint.
Time-Course Study Design
Begin by defining your storage conditions. Real-world conditions (room temperature, ambient light, standard refrigeration) reveal practical stability. Accelerated conditions (elevated temperature, light exposure, oxidative stress) compress months of degradation into weeks, allowing faster decision-making.
Collect samples at regular intervals: day 0, day 1, day 7, day 14, day 28, and beyond. Early timepoints reveal rapid degradation. Later timepoints show whether degradation plateaus or continues.
At each timepoint, inject an identical volume of sample into your LC-MS system. Use the same column, gradient, and instrument settings as your baseline. Consistency is essential, any variation in method introduces noise that masks real degradation trends.
Quantification and Reporting Results
Your LC-MS produces chromatographic peaks at specific retention times and m/z values. Peak area correlates with concentration. By measuring peak areas for intact peptide and each degradation product, you quantify what percentage of your sample remains intact.
Report results as percentage intact versus percentage degraded. A typical format:
- Day 0: 99.2% intact, 0.8% degraded
- Day 7: 97.5% intact, 2.5% degraded
- Day 28: 94.1% intact, 5.9% degraded
This data reveals degradation rate. If your peptide loses 5% integrity per month, you know its practical shelf life under those conditions. Compare stability outcomes between different storage formats to identify which approach preserves your peptides longest.
Troubleshooting Common Issues and Avoiding False Positives
Real degradation detection requires distinguishing actual peptide breakdown from preparation artefacts, instrumental noise, and false signals.
Peak shifts without mass change: Sometimes a peak moves to a different retention time without changing m/z.
Unexpected mass shifts: A mass shift that doesn't match any known degradation pathway (oxidation +16, deamidation +1, hydrolysis -18) suggests a data-processing error.
Peaks appearing only in one replicate: Inconsistent degradation across replicates suggests preparation variability, not sample degradation. Use fresh aliquots from the same batch.
High background noise: Contaminated buffers, old columns, or improperly cleaned equipment introduce baseline noise that masks small degradation peaks. Use fresh, high-purity buffers.
Learn step-by-step purity testing to verify your results and rule out false positives before drawing conclusions about degradation.
A common mistake is over-interpreting small peaks.
Detecting peptide degradation using mass spectrometry techniques protects your research integrity.
At Everform Research, we understand that reliable peptide quality underpins everything you do downstream.
Ready to work with peptides you can trust? Shop our verified compounds and receive 15% off your first order with code EVER15.
Frequently Asked Questions
How can mass spectrometry detect peptide degradation?
Mass spectrometry identifies degradation products by measuring their mass-to-charge ratio (m/z) and fragmentation patterns. When peptides degrade through hydrolysis, oxidation, or deamidation, their molecular mass changes. High-resolution mass spectrometry can detect these mass shifts as small as 1%, revealing truncated peptides, modified forms, and other impurities. Tandem mass spectrometry (MS/MS) further confirms identity through sequence fragmentation analysis.
What sample preparation is needed for peptide stability analysis?
Proper sample preparation is critical for accurate results. Store peptide samples at -20 °C or lower in appropriate buffers to minimise degradation before analysis. Remove samples from frozen storage just before preparation, dissolve them in mass spectrometry-compatible solvents (typically acetonitrile and water with formic acid), and filter through 0.2 µm membranes to remove particulates. Avoid repeated freeze-thaw cycles, which can accelerate degradation and introduce artefacts.
How can LC-MS/MS identify peptide oxidation and deamidation?
LC-MS/MS detects oxidation through characteristic mass shifts: methionine oxidation adds 16 Da, whilst histidine oxidation adds 14 Da. Deamidation converts asparagine or glutamine to aspartate or glutamate, adding 0.98 Da. High-resolution instruments resolve these shifts, and tandem MS fragmentation patterns confirm which residues are modified. Chromatographic separation isolates modified forms from intact peptides, allowing quantification of each degradation product.
How do you distinguish peptide degradation products from analytical artefacts?
Artefacts arise from ionisation, sample handling, or instrument settings. Use multiple controls: analyse blank samples, run the same peptide on different instruments, and vary analytical parameters (pH, temperature, solvent). True degradation products show consistent mass shifts and fragmentation patterns across replicates, whilst artefacts are often inconsistent or disappear with modified conditions. Parallel HPLC analysis confirms that observed m/z shifts correspond to actual chromatographic peaks, not instrumental noise.